- About KC Streetcar
- Explore the Route
- How to Ride
- Employment
- News + Meetings
- Advertising & Opportunities
- Streetcar Swag
- RideKC Statement 2.15.2024
Ridership
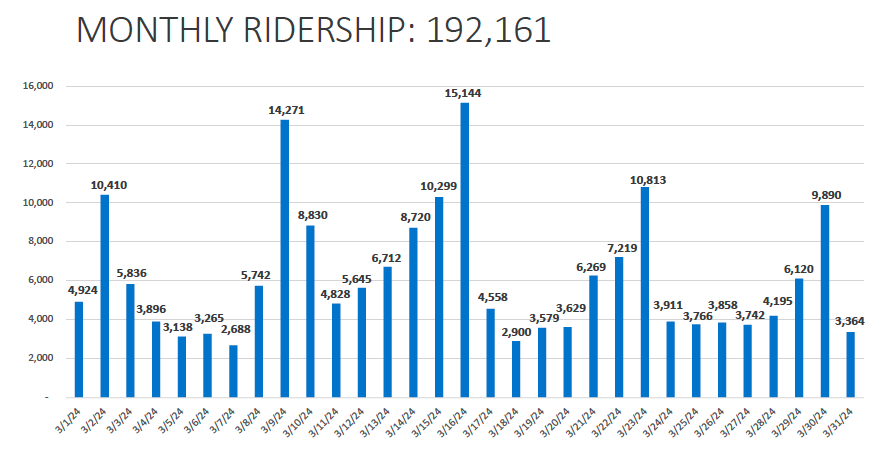
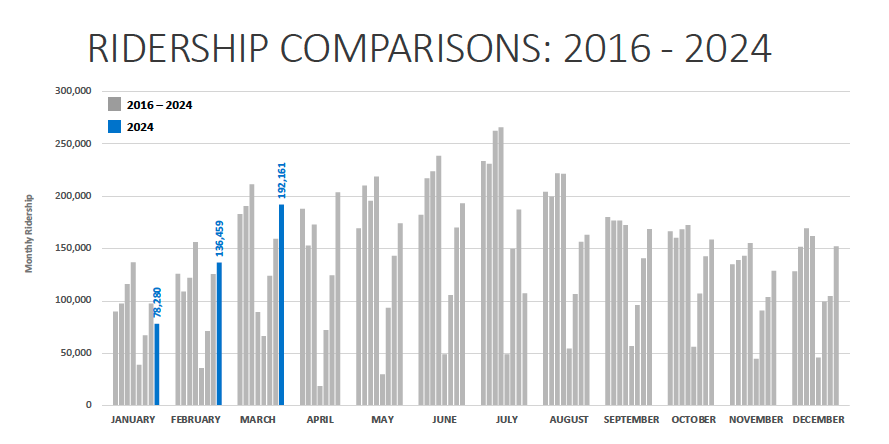
March 2024


Click here for a listing of ridership numbers by date from May 6 – December 31, 2016, the KC Streetcar’s first year of service.
Rides, otherwise known as “Unlinked Passenger Trips”
The KC Streetcar Authority monitors and tracks daily ridership on board the KC Streetcar. Streetcar ridership, otherwise known as “Unlinked Passenger Trips”, is the national standard used by the Federal Transit Administration (FTA) for calculating usage on public transportation systems across the county. FTA Definition of “Unlinked Passenger Trips” (UPT): The number of passengers who board public transportation vehicles. Passengers are counted each time they board vehicles no matter how many vehicles they use to travel from their origin to their destination. KC Streetcar ridership or UPTs is calculated by Automated Passenger Counters (APC) located over each door of each streetcar vehicle. Passengers are counted as they board and exit the streetcars, and the data collected shows which stops are the most used and which hours of the day are the busiest. The ridership data is downloaded and reviewed daily by a third-party for accuracy, using the same methodology utilized for transit services regionally, and common across the county.
Manual passenger count verifications are performed on a regular basis, approximately every two years. The most recent test in 2022 showed the automatic passenger counters (APCs) to be 99% accurate (APCs were .5% below manual counts).